Report | Intelligent Investment
The Debt Funding Gap for Asia Pacific Real Estate
May 28, 2024 10 Minute Read

Executive Summary & Outlook
Looking for a PDF of this content?
With the Asia Pacific commercial real estate market currently sitting at the top of the interest rate hike cycle, attention continues to focus upon the sizable volume of outstanding senior loans due to mature; a situation which could lead to a substantial funding gap in the coming years.
Using investment volumes as a proxy for lending, CBRE estimates that there is currently US$257 billion of outstanding senior commercial real estate debt in Asia Pacific, leading to a projected funding gap of US$8.4 billion between 2024-2026.
With the exception of Hong Kong SAR, LTVs in Asia Pacific remain largely unchanged. CBRE expects a funding gap to arise in markets where there is still some degree of capital value decline expected over the next three years. By total volume, Australia will have the biggest funding gap between 2024-26, followed by mainland China. The gap will be highly concentrated in the office sector, with CBRE expecting some further repricing over the remainder of 2024.
Interest expenses are slated to increase significantly in some markets. Developers and fund managers with re-financing risk in these locations are expected to be net sellers in 2024.
While there are likely to be more opportunities for equity investors to acquire assets at more attractive valuations, there will also be solid prospects for alternative lenders or NPLs. However, CBRE expects debt-specific funds to be limited, with most likely to consist of partly traditional strategies such as value-add, owing to the limited funding gap and capital raising issues within the region.
CBRE expects Asia Pacific to witness a limited number of distressed deals compared to the U.S. and Europe. Investors in markets such as Australia, Hong Kong SAR, mainland China and Korea will be motivated to sell non-performing assets in secondary locations for additional liquidity.
Market and balance sheets still catching up to reality
Markets continue to go through repricing cycle in 2024
- With the exception of those in mainland China, Japan and Singapore, current investments in most markets have been repriced in the range of 50bps to 200bps of cap rate expansion.
- Repricing has been most substantial in the office sector, particularly in Australia. In Korea, repricing has been most significant in the logistics sector.
- Valuations in Asia Pacific lag the U.S. and Europe, where transactional cap rates are meeting existing market values.
Loan restructuring underway
- While traditional lending is still available in most markets, banks are looking to reduce commercial real estate and development exposure across Asia Pacific, especially in Australia, mainland China, Hong Kong SAR and Korea.
- Asset owners are exploring a range of solutions to bridge the funding gap, such as disposing of assets and putting more equities or switching loans from offshore to onshore, especially in mainland China.
- Interest Coverage Ratios (ICRs) and interest expenses remain top of mind for property owners considering refinancing.
Investment volumes remain subdued
- While the negative carry gap is closing, a bid-ask spread still exists in most markets, particularly for secondary assets.
- With rate cuts now expected to commence by H2 2024, CBRE expects Asia Pacific commercial real estate investment volume to grow by 5% y-o-y in 2024, led by Japan, India and Korea.
- Investor appetite continues to focus on core assets in tier I markets plus India.
New capital still limited
- Capital raising in 2024 remains challenging amid mounting pressure for funds to deploy dry powder currently sitting on the sidelines.
- With a limited funding gap in Asia Pacific, new capital raising will focus on value-add with a component of debt and core strategies.
The state of the lending market
Interest rates in most global markets are set to fall by H2 2024
The expected easing of central bank policy rates in mid-2024 should give investors greater confidence to move forward with acquisitions in the coming months.CBRE forecasts that both the European Central Bank (ECB) and the U.S. Federal Reserve will begin cutting rates by H2 2024.
Mainland China has already lowered policy rates to stimulate growth and Japan ended its negative interest rate environment in March 2024. Other Asia Pacific countries are expected to begin cutting rates before the end of the year.
While rate cuts are expected to commence in the latter half of the year, the magnitude of any reductions will be lower than what was expected six months ago. As a result, interest rates are expected to remain elevated for the short to medium-term.
Figure 1: Central policy interest rates

(Click to enlarge)
LTVs and spreads (margins) on new senior loans have generally remain unchanged in Asia Pacific
In general, Loan-to-Value (LTV) ratios in the Asia Pacific real estate market have remained largely consistent since authorities sought to restrict lending for real estate investment. The only markets to see some movement in LTV ratios over the past 36 months have been Hong Kong SAR (from 50% to 60%) and Australia (from 55% to 50%). While the upper limit of the LTV ratio was increased in Hong Kong SAR as a Hong Kong Monetary Authority directive in order to quell distress fears, banks within Hong Kong SAR may take a different stance due to conservative views on current valuations.Spreads, which are margins lenders add on top of reference rates for lending as a proxy for risk, have also seen little movement over the past 36 months. The only exceptions are Hong Kong SAR, where spreads have fallen from 230-300 bps to 50-200 bps; and Korea, which has seen a 60 bps decrease.
Figure 2: Loan-to-value (LTV) ratios (%) – Asia Pacific markets (upper limit)

(Click to enlarge)
Figure 3: Reference rate + margin (spread) – Asia Pacific markets (prime assets)

(Click to enlarge)
More significant asset repricing has been observed in the United States and Europe than in Asia Pacific
The last stage of the repricing cycle will end the significant expansion in cap rates observed over the past 24 months. U.S. and European assets have seen much greater cap rate growth than those in Asia Pacific.With valuations lagging in Asia Pacific, CBRE expects some further repricing to occur in 2024, particularly in Australia, mainland China, Korea and Hong Kong SAR.
Due to repricing in Asia Pacific being somewhat limited compared to the other regions, funding gap pressure is far more limited compared to what has been observed in the U.S. and Europe.
Figure 4: Aggregate yields (% across sectors)

(Click to enlarge)
Office assets expected to see further repricing in 2024; shopping malls in select locations also under repricing pressure
While overall real estate investment activity is expected to pick up moderately in 2024, investors foresee further repricing throughout the year.Although investors are focused on securing discounts for value-add and core office acquisitions in all regions, the outlook for Asia Pacific offices is somewhat brighter than in the U.S. and Europe. Many buyers believe that further price erosion and increased tenant demand are needed to justify current pricing.
Investors anticipate relatively less repricing pressure in the hotel and residential sectors. Hotels remain in a cyclical recovery phase, while the housing sector, especially multifamily, continues to benefit from structural tailwinds.
Figure 5: Pricing expectations in 2024

Source: 2024 CBRE Investor Intentions Survey, CBRE Research, February 2024
(Click to enlarge)
Asia Pacific commercial real estate debt market
Higher interest rates and prolonged uncertainty about timing of rate cut cycle weigh on investment volume
Following a strong 2021 and H1 2022, abrupt and substantial central policy rate hikes have stifled investment into commercial real estate over the past 18 months.The significant hike in interest rates combined with worries of a global economic slowdown has widened the gap between buyer and seller expectations, leading all markets in Asia Pacific to register a sharp slowdown in commercial real estate transaction activity between 2021 and 2023.
While investment activity is expected to pick up slightly in H2 2024, CBRE expects investors, particularly private/HNWs and institutional buyers, to become more active once there is greater clarity around future rate movements in H2 2024.
Figure 6: Investment volumes – Asia Pacific

Source: CBRE Research, Q1 2024
(Click to enlarge)
CBRE estimates there is at least US$257bn of outstanding commercial real estate senior loans in Asia Pacific
For this exercise, CBRE has assumed that all private investors and property funds use a non-recourse loan structure for debt origination in Asia Pacific, with all other investors under a recourse loan structure. CBRE therefore estimates that US$71 billion or 28% of all outstanding debt in Asia Pacific is non-recourse, while US$186 billion or 72% is recourseAs Asia Pacific has a greater share of recourse loans, there is a relatively lower chance of distressed assets coming to market. If a borrower fails to live up to their obligations on a recourse loan and defaults on the payment schedule, the lender will first seize and sell the collateral specified in the loan. From the lender's point of view, a recourse loan reduces the potential risk associated with less creditworthy borrowers. As lenders can reduce the risk associated with these loans, they can charge a lower interest rate, thereby making them more attractive to borrowers.
Figure 7: Estimated CRE debt – Asia Pacific (US$bn)

Note: CBRE assumes non-recourse loans in Asia Pacific are taken by private investors and property funds. All other investors are assumed to take recourse loans
Source: CBRE Research Q1 2024
(Click to enlarge)
Interest expenses continue to play major part in refinancing decisions
Assuming LTVs and capital values remain stable, a driving factor behind investment decisions at the re-financing stage of the cycle will be the substantial increase in interest expenses.This phenomenon is most evident in Australia and Hong Kong SAR, where interest expenses on refinancing in the next two years will be as much as 1.9x greater than initial loans. Japan will also be affected over the next two years following the end of negative interest rates. With many borrowers being highly leveraged, any movement in rates will have a more significant impact on their interest expenses despite current low rates.
Smaller companies and developers with lower credit ratings may be even more exposed, with margins on new loans for these investors widening significantly and available debt sources drying up due to a combination of banks adopting a stringent attitude towards lending and expectations that rental growth is likely to be muted this year.
Figure 8: Estimated interest expenses on refinance – Asia Pacific (US$mn)

Source: CBRE Research May 2024
(Click to enlarge)
Interest coverage ratios (ICRs) for many office markets still below needed levels
Office owners in Asia Pacific typically seek an ICR of 2.0x during their holding period, with a minimum of 1.5x needed to keep balance sheets in the black.After ICRs in all key Asia Pacific markets climbed above 1.5x in 2021, the sharp increase in rates saw a significant decline in ICRs in 2022.
Using CBRE’s current office rental growth assumptions, most markets will see an improvement in ICRs in 2024.
Figure 9: Interest coverage ratios (ICRs) – Asia Pacific office

Note: 1: Interest coverage ratio (ICR) is a ratio of the weighted net operating income (NOI) over the interest expenses incurred by the calculated loan. A lower ICR means a greater debt burden with less NOI to cover interest expenses
Note 2: Australia office ICR weighted across Sydney, Melbourne and Brisbane
Note 3: *Numbers as of Q1 2024
(Click to enlarge)
Where is the funding gap?
The debt funding gap differs across markets for example, the Sydney CBD office
To further this analysis, CBRE looked at the funding gap for the entire Australian office sector in 2024, using investment volumes as a proxy for loan origination in 2021 (US$13 billion).CBRE forecasts weighted capital values of office properties in Australia to fall by 19% between 2021 and 2024, and LTVs to change from 55% to 50% in the same period.
Two components are used to calculate the funding gap: 1) the change in capital values between the origination of the loan and the refinancing, and 2) the change in LTV ratio available at the time of origination and refinancing.
Assuming a changing LTV of 55% at origination, to 50% at refinance, and assuming that all office investment in Australia was leveraged and had a three-year loan maturity, this would create a debt-funding gap of US$1.91 billion. This would result in a 15% funding gap on the total investment volume, or a 33% funding gap on the original equity amount.
Figure 10: Funding gap example – Australia CBD office

Source: CBRE Research, Q1 2024
(Click to enlarge)
Some funding gap to arise, but volume will be minimal compared to Europe and the U.S.
With LTVs in Asia Pacific remaining mostly unchanged, much of the debt funding gap is a consequence of declining capital values. Office is the most exposed sector to the debt funding gap, with CBRE forecasting a gap of US$6.1 billion over the next three years. The funding gap will be largely concentrated in the office sector in Australia and mainland China, with a funding gap expected to occur in both 2024 and 2025. Although the relaxation of LTV rations has prevented a funding gap for offices in Hong Kong SAR, CBRE believes this asset class will continue to face challenges around refinancing discussions. Few offices have been transacted at significant discounts in so far in 2024.The funding gap in Asia Pacific is minimal compared to the U.S. and Europe. According to CBRE EA, the funding gap for U.S. commercial real estate currently stands at US$157.3 billion, and for European commercial real estate at US$191.4 billion. As in Asia Pacific, much of this funding gap has been driven by significant capital value decline. However, LTV change has been the largest differentiator, with LTVs for commercial real estate in the U.S. dropping from 72% to 57%, and falling from ~65% to ~55% across Europe.
Figure 11: Funding gap – By market and sector (Asia Pacific, US$mn)

(Click to enlarge)
Capital value decline drives funding gap in Asia Pacific
Since the beginning of 2021, the Asia Pacific retail and industrial sectors have witnessed limited capital value declines. Expectations are for both sectors to experience modest capital value growth in 2024.However, some office markets in the region, particularly Australia, mainland China and Hong Kong SAR, are expected to see some capital value decline in 2024.
Figure 12: Capital value index – Asia Pacific (2021 = 100)

Source: CBRE Research, Q1 2024
(Click to enlarge)
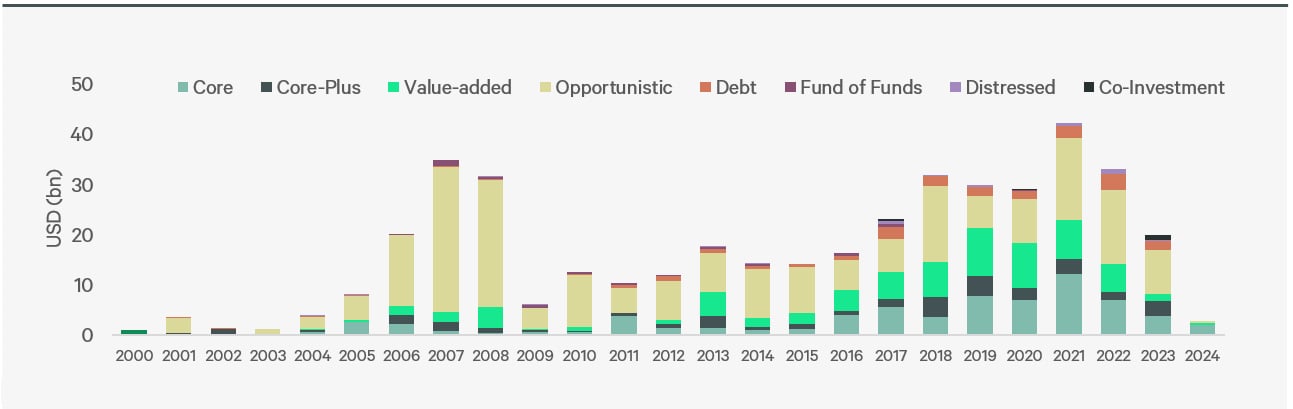
Available capital (dry powder) for commercial real estate investment still elevated, with limited fund raising so far in 2024
Opportunistic and value-add strategies are a focus for unallocated private equity real estate capital globally, with approximately 41% of all unallocated real estate capital worldwide targeting these strategies.With limited distress in Asia Pacific, fund raising for debt strategies will remain limited in 2024, leaving investors to instead focus on traditional strategies such as value-add and core.
Figure 13: Asia Pacific private equity fundraising levels for commercial real estate – by strategy (US$bn)
(Click to enlarge)
Figure 14: Asia Pacific private equity dry powder levels for commercial real estate – by strategy (US$bn)

(Click to enlarge)
Conclusion
Limited opportunities for non-performing loans (NPLs) and debt strategies
With the size of the funding gap in Asia Pacific smaller compared to other regions, opportunities for distressed assets distressed assets and non-performing loans (NPLs) for investors to target are limited. Therefore, we expect traditional fundraising sectors, particularly value-add and core strategies, to remain the favoured options within Asia Pacific.Office sector to see greatest funding gap, however distress will be limited
Most of this gap is expected to arise in mainland China and Australia, where flight to quality and price correction has been more prominent than other sectors. While core assets will be affected, value-added assets in secondary locations will be most at risk.Banks’ attitude will be a significant factor effecting distress
Given that most loans in Asia Pacific are recourse, banks’ attitude will have a large impact on where the funding gap occurs. While this means that there will be less pressure on interest expenses/ICRs overall, if banks become more aggressive in pursuing assets within underperforming investor portfolios, then the risk of distress within certain markets/sectors will be higher.Accommodative lending environment in Asia Pacific will see future funding distress limited
Loan-to-Value ratios have been much more stable in Asia Pacific compared to Europe and the U.S. as a result. Moving forward, this is expected to be the case, which will mean that funding gap pressures in future market downturns will be much less pronounced in Asia Pacific compared to the other regions.CBRE’s current house view is that the Federal Reserve will cut rates twice in 2024, meaning that interest rates in Asia Pacific will remain elevated for longer. Investors will have to be creative with their debt strategies, with development and bridge loans limited in select markets such as Australia. Refinance pressure is likely to come from private equity funds and private high net worths. Therefore, there will be further price discovery through Asia Pacific.
Related Insights
- Viewpoint | Intelligent Investment
Analysing the Funding Gap: A Bird's-Eye View of the Asia Pacific Commercial Real Estate Debt Market
May 4, 2023

With the Asia Pacific commercial real estate market witnessing rapid increases in financing costs, attention is turning to the sizable volume of outstanding sen...

CBRE professionals in Asia Pacific note that the timing for a recovery in investment activity has been pushed back amid limited risk appetite and delays to interest rate cuts. Nearly 70% of respondents expect a recovery from Q4 2024 onwards.
Our Research Team


Kontakt
Greg Hyland
Head of Capital Markets, Asia Pacific

Callum Young
Executive Director, Capital Markets, Asia Pacific

